Point-and-Figure (P&F) Chart and Tactics
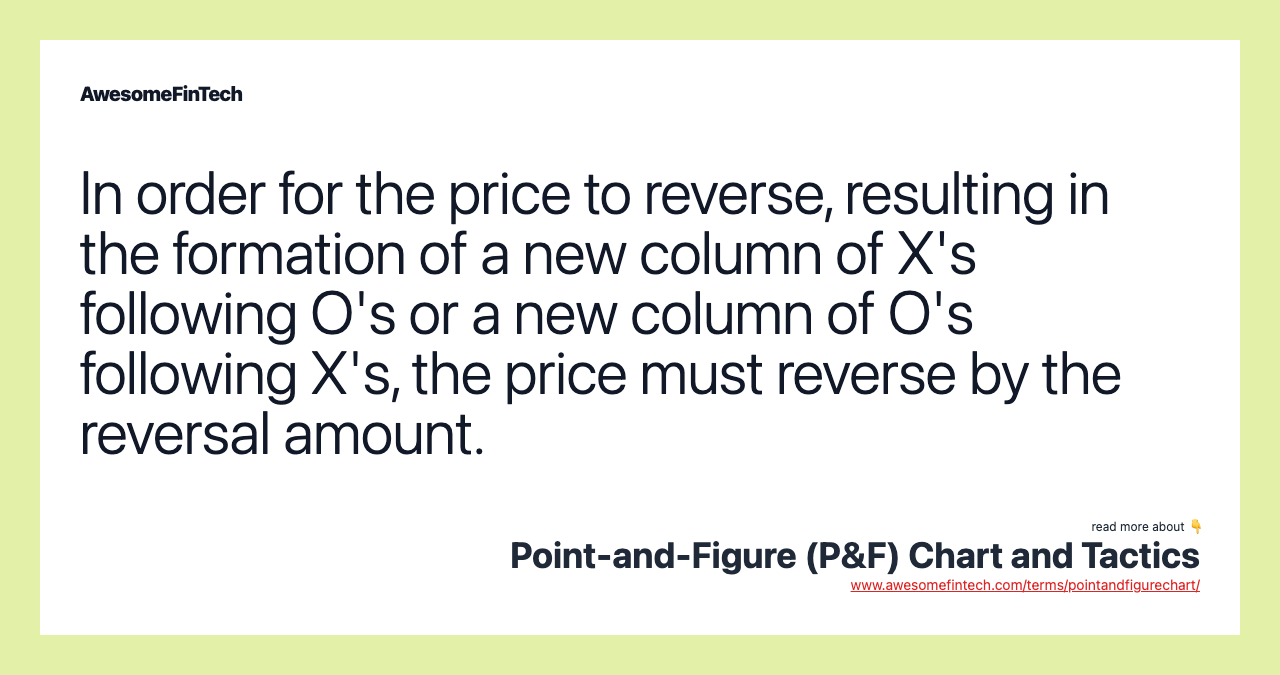
A point-and-figure chart plots price movements for stocks, bonds, commodities, or futures without taking into consideration the passage of time. A reversal occurs when the price is no longer moving enough to put another X or O in the current X or O column, and then the price moves at least three box sizes (if this is the chosen reversal amount) in the opposite direction. In order for the price to reverse, resulting in the formation of a new column of X's following O's or a new column of O's following X's, the price must reverse by the reversal amount. For example, following a price rise or column of X's, if a reversal occurs and the reversal amount is three box sizes, when the reversal occurs three O's will be drawn starting one spot below the highest X. Depending on the box size, the columns themselves can represent significant trends, and when the column changes (from O to X, or X to O) that may signal a significant trend reversal or pullback.
What Is a Point-and-Figure (P&F) Chart?
A point-and-figure chart plots price movements for stocks, bonds, commodities, or futures without taking into consideration the passage of time.
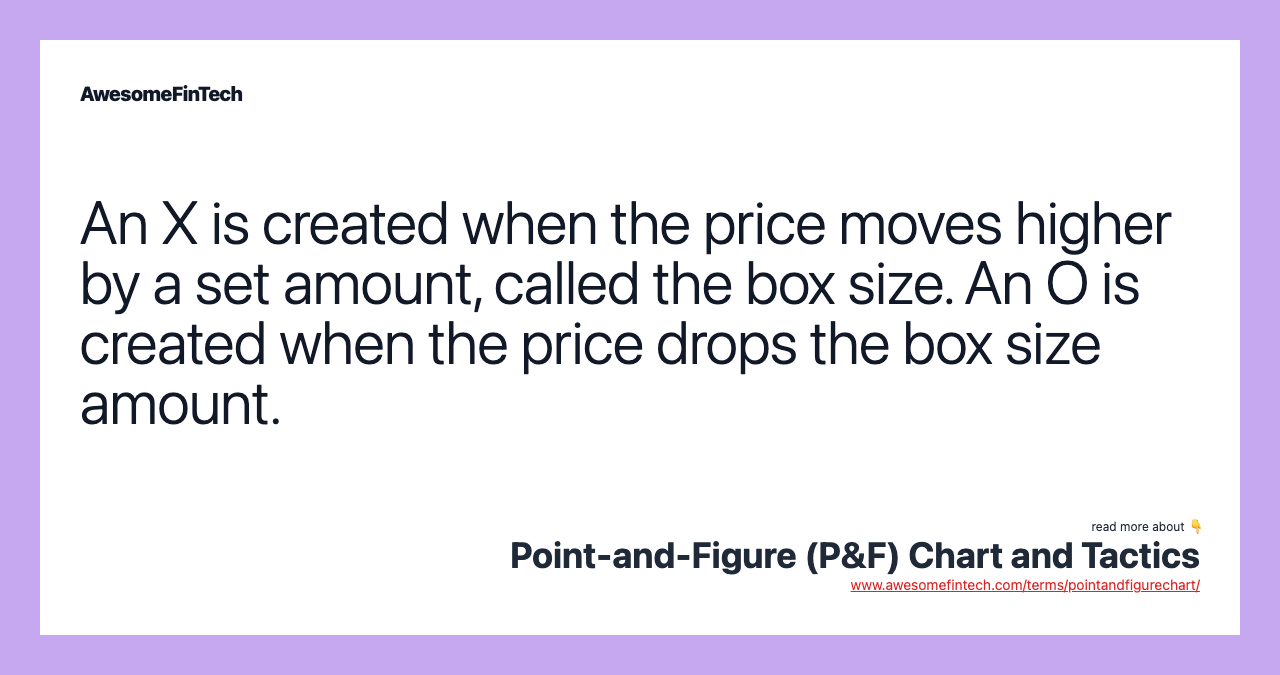
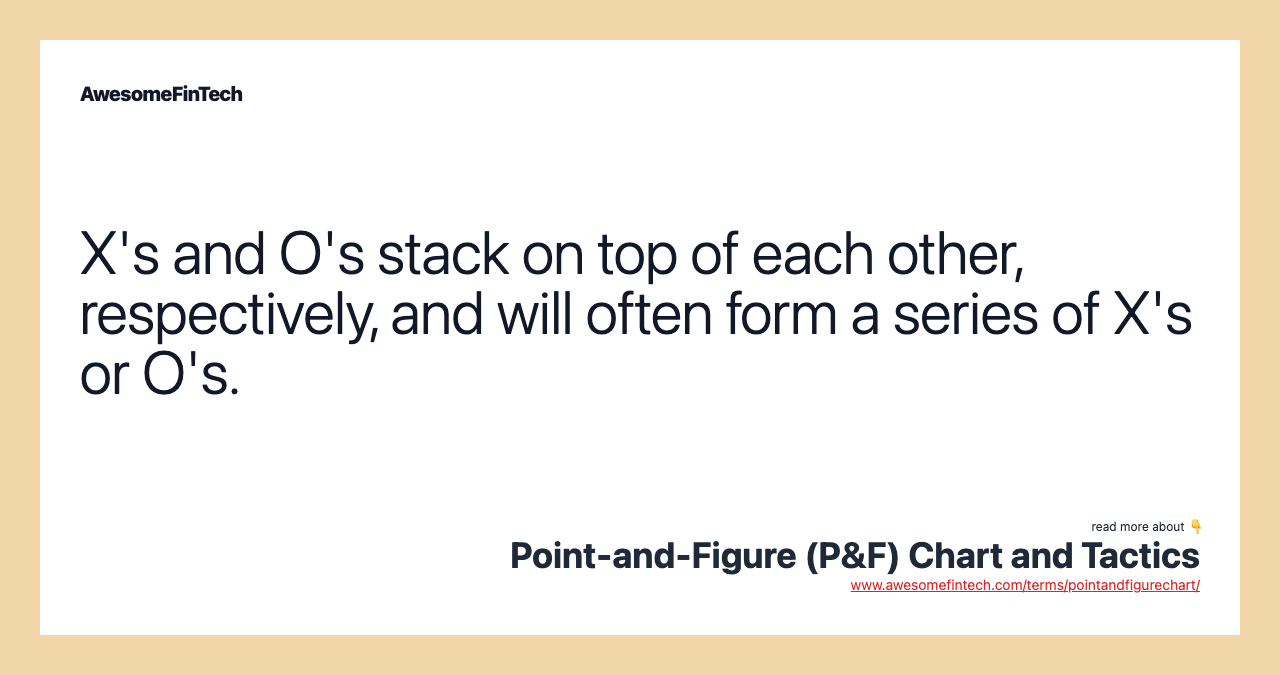
Contrary to some other types of charts, like candlesticks, which mark the degree of an asset's movement over set time periods, P&F charts utilize columns consisting of stacked X's or O's, each of which represents a set amount of price movement. The X's illustrate rising prices, while O's represent a falling price.
Technical analysts still utilize concepts such as support and resistance, as well as other patterns, when viewing P&F charts. Some argue that support and resistance levels, as well as breakouts, are more clearly defined on a P&F chart since it filters out tiny price movements and is less susceptible to false breakouts.

TradingView.
How to Calculate Point-and-Figure (P&F) Charts
Point-and-figure charts don't require calculation, but they do require at least two variables to be set.
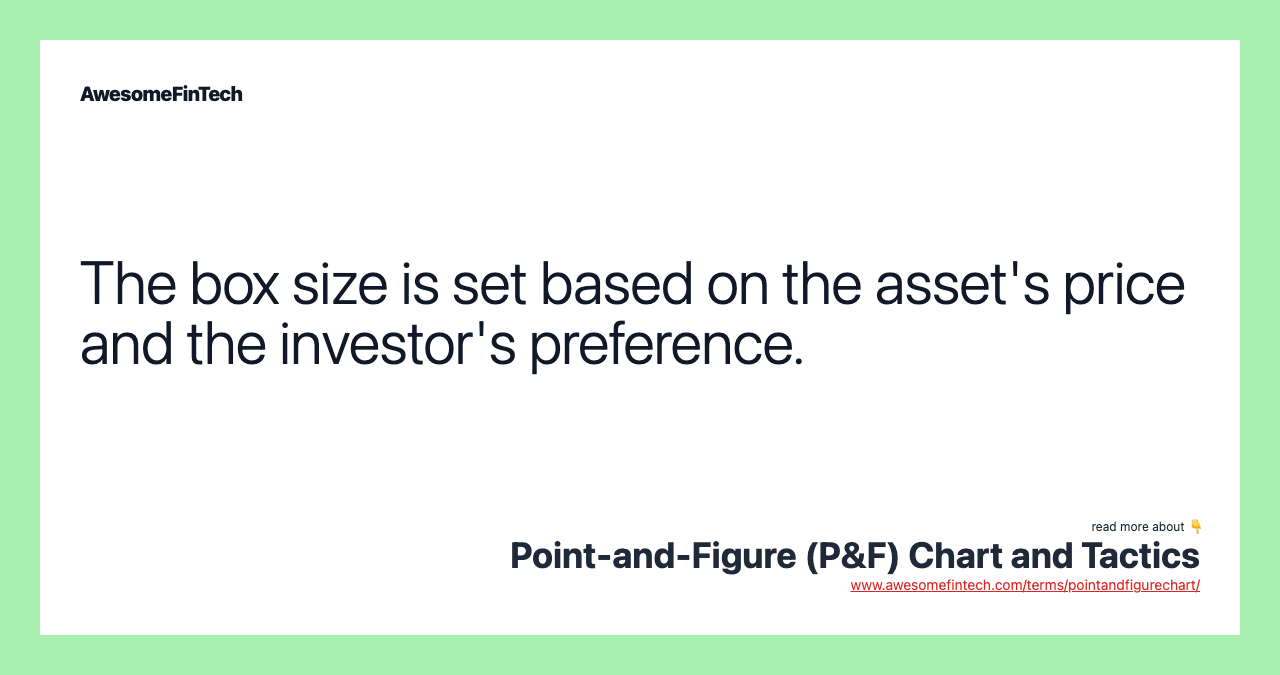
One variable is the box size. The box size can be a specific dollar amount, such as $1, a percentage, such as 3% of the current price, or it can be based on average true range (ATR) which means the box size will fluctuate based on volatility.
The reversal amount also needs to be set. The reversal amount is typically three times the box size. For example, if the box size is $1, the reversal amount is $3. The reversal can be set at anything the trader desires, such as one times the box size, or 5.5 times the box size.
An optional variable is whether to use high and low prices for the underlying asset or to use closing prices. Using high and low prices will mean the creation of more X's and O's, while using only closing prices (less movement being calculated compared to high and lows) will mean fewer X's and O's are created.
What Does a Point-and-Figure (P&F) Chart Tell You?
Point-and-figure charts often provide technical analysts with different trade and trend signals, relative to traditional candlestick or bar charts. While some analysts rely more heavily on the point-and-figure charts, others use these charts to confirm signals provided by traditional charts in an effort to avoid false breakouts.
The key to point-and-figure charting is the box size, or the amount of price movement that determines whether a new X or O is added to the chart. For example, say the box size is $3. If the last X happened at a price of $15, a new one is added to the current column of X's when the price rises to $18.
Notably, the line of X's continues in the same column, provided that the price continues to rise and doesn’t breach a predetermined reversal amount, at which point, a new column of O's begins.
The same is true for a column of O's in a declining market; the column continues until the stock reaches the reversal amount, at which point a new column of X's begins.
A reversal occurs when the price is no longer moving enough to put another X or O in the current X or O column, and then the price moves at least three box sizes (if this is the chosen reversal amount) in the opposite direction. When a reversal occurs, several X's or O's will be drawn at the same time. For example, following a price rise or column of X's, if a reversal occurs and the reversal amount is three box sizes, when the reversal occurs three O's will be drawn starting one spot below the highest X.
Traders utilize P&F charts in similar ways to other charts. Traders still watch for support and resistance levels. Breakouts can signal major trend changes. Depending on the box size, the columns themselves can represent significant trends, and when the column changes (from O to X, or X to O) that may signal a significant trend reversal or pullback.
Point-and-Figure Analysts
Charles Dow, the founder of The Wall Street Journal, is credited with developing point-and-figure charting as a way to determine imbalances between supply and demand.
One of the foremost technical analysts specializing in point-and-figure charting is Tom Dorsey, who founded the research firm Dorsey, Wright & Associates in 1987. He authored several books on the topic, including Point & Figure Charting: The Essential Application for Forecasting and Tracking Market Prices. Nasdaq purchased Dorsey, Wright & Associates in 2015.
Dorsey helped to popularize the use of point-and-figure charts with more traditional technical indicators, such as moving averages, relative strength, and advance/decline lines.
The Difference Between Point-and-Figure (P&F) and Renko Charts
Renko Charts are also based on box size, and when the price moves by the box size it creates an up or down brick that moves at a 45-degree angle to the prior brick. Renko charts never have bricks next to each other. Therefore, a reversal occurs if the price moves in the opposite direction by two box amounts.
The main difference between the chart types is the look. P&F charts are side-by-side columns of X's and O's, while a renko chart is created by a series of boxes spread out over time at 45-degree angles.
Limitations of Using Point-and-Figure (P&F) Charts
P&F charts can be slow to react to price changes. A breakout, for example, must move the box amount in order to signal a breakout occurred. This may benefit some traders as it may reduce false breakout signals, but the price has already moved the box amount (or more) beyond the breakout point. For some traders, getting the signal after the price has already moved that much may not be effective.
Also, while P&F charts may help reduce the number of false breakouts, false breakouts still occur. What appears to be a breakout may still be reversed a short time later.
P&F charts are good at keeping traders in strong trends, as a lot of small counter-trend movements are filtered out. Yet when a reversal occurs it can significantly erase profits or result in big losses. Because the reversal amount is typically so large, if a trader is only using P&F charts they won't see the reversal until the price has moved significantly against them.
When using P&F charts, it is recommended to also watch the actual price of the asset so that risk can be monitored in real time. This can be done by monitoring a candlestick or open-high-low-close (OHLC) chart.
Related terms:
Advance/Decline Line - A/D and Uses
The Advance/Decline Line (A/D) is a technical indicator that shows the number of advancing stock less the number of declining stocks. It is a breadth indicator used to show market sentiment. read more
Average True Range (ATR) & Formula
The average true range (ATR) is a market volatility indicator used in technical analysis. read more
Bear Market : Phases & Examples
A bear market occurs when prices in the market fall by 20% or more. read more
Box Size
A box size is the minimum price change that must occur before the next mark is added to a point-and-figure (P&F) chart. read more
Breakout and Example
A breakout is the movement of the price of an asset through an identified level of support or resistance. Breakouts are used by some traders to signal a buying or selling opportunity. read more
Closing Price
Even in the era of 24-hour trading, there is a closing price for a stock or other asset, and it is the last price it trades at during market hours. read more
Count
Count is a form of technical analysis that employs point and figure (P&F) charts to evaluate the vertical movement of stock prices. read more
Failed Break and Example
A failed break occurs when a price moves through an identified level of support or resistance but does not have enough momentum to maintain its direction. read more
False Signal
In technical analysis, a false signal refers to an indication of future price movements that gives an inaccurate picture of the economic reality. read more