Income Statement : Uses & Examples
Table of Contents What is an Income Statement? Understanding the Statement Revenues and Gains Expenses and Losses Though the retail giant beats the technology leader in terms of annual EPS, Microsoft had a lower cost for generating equivalent revenue, higher net income from continuing operations, and higher net income applicable to common shares compared to Walmart. Though the main purpose of an income statement is to convey details of profitability and business activities of the company to the stakeholders, it also provides detailed insights into the company’s internals for comparison across different businesses and sectors. These revenues are sourced from the earnings which are outside of the purchase and sale of goods and services and may include income from interest earned on business capital lying in the bank, rental income from business property, income from strategic partnerships like royalty payment receipts or income from an advertisement display placed on business property. Essentially, it gives an account of how the net revenue realized by the company gets transformed into net earnings (profit or loss). The following are covered in the income statement, though its format may vary depending upon the local regulatory requirements, the diversified scope of the business and the associated operating activities: Revenue realized through primary activities Listed companies follow the Multiple-Step Income Statement which segregates the operating revenues, operating expenses, and gains from the non-operating revenues, non-operating expenses, and losses, and offer many more details through the income statement.
What is an Income Statement?
An income statement is one of the three important financial statements used for reporting a company's financial performance over a specific accounting period, with the other two key statements being the balance sheet and the statement of cash flows.
Also known as the profit and loss statement or the statement of revenue and expense, the income statement primarily focuses on the company’s revenues and expenses during a particular period.
Understanding the Income Statement
The income statement is an important part of a company’s performance reports that must be submitted to the Securities and Exchange Commission (SEC). While a balance sheet provides the snapshot of a company’s financials as of a particular date, the income statement reports income through a particular time period and its heading indicates the duration, which may read as “For the (fiscal) year/quarter ended September 30, 2018.”

Theresa Chiechi {Copyright} Investopedia, 2019.
The income statement focuses on four key items — revenue, expenses, gains, and losses. It does not differentiate between cash and non-cash receipts (sales in cash versus sales on credit) or the cash versus non-cash payments/disbursements (purchases in cash versus purchases on credit). It starts with the details of sales, and then works down to compute the net income and eventually the earnings per share (EPS). Essentially, it gives an account of how the net revenue realized by the company gets transformed into net earnings (profit or loss).
Revenues and Gains
The following are covered in the income statement, though its format may vary depending upon the local regulatory requirements, the diversified scope of the business and the associated operating activities:
Operating Revenue
Revenue realized through primary activities is often referred to as operating revenue. For a company manufacturing a product, or for a wholesaler, distributor or retailer involved in the business of selling that product, the revenue from primary activities refers to revenue achieved from the sale of the product. Similarly, for a company (or its franchisees) in the business of offering services, revenue from primary activities refers to the revenue or fees earned in exchange of offering those services.
Non-Operating Revenue
Revenues realized through secondary, non-core business activities are often referred to as non-operating recurring revenues. These revenues are sourced from the earnings which are outside of the purchase and sale of goods and services and may include income from interest earned on business capital lying in the bank, rental income from business property, income from strategic partnerships like royalty payment receipts or income from an advertisement display placed on business property.
Also called other income, gains indicate the net money made from other activities, like the sale of long-term assets. These include the net income realized from one-time non-business activities, like a company selling its old transportation van, unused land, or a subsidiary company.
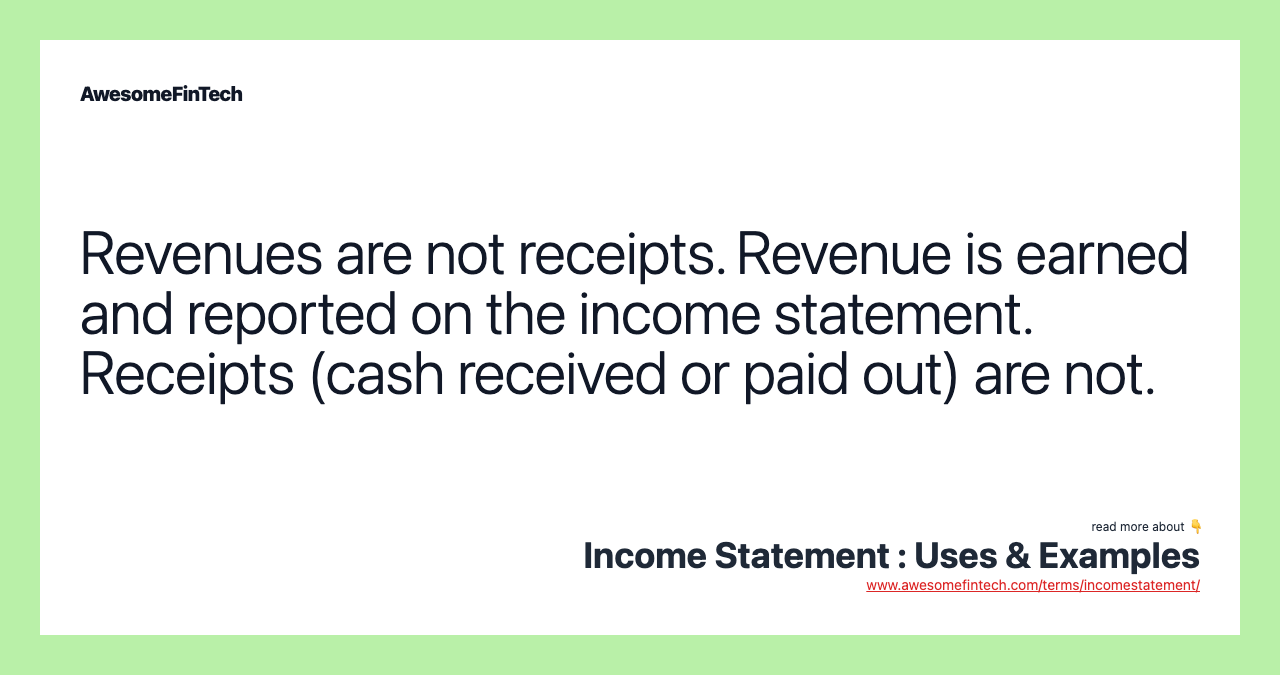
Revenue should not be confused with receipts. Revenue is usually accounted for in the period when sales are made or services are delivered. Receipts are the cash received and are accounted for when the money is actually received. For instance, a customer may take goods/services from a company on 28 September, which will lead to the revenue being accounted for in the month of September. Owing to his good reputation, the customer may be given a 30-day payment window. It will give him time till 28 October to make the payment, which is when the receipts are accounted for.
Expenses and Losses
The cost for a business to continue operation and turn a profit is known as an expense. Some of these expenses may be written off on a tax return if they meet the IRS guidelines.
Primary Activity Expenses
All expenses incurred for earning the normal operating revenue linked to the primary activity of the business. They include the cost of goods sold (COGS), selling, general and administrative expenses (SG&A), depreciation or amortization, and research and development (R&D) expenses. Typical items that make up the list are employee wages, sales commissions, and expenses for utilities like electricity and transportation.
Secondary Activity Expenses
All expenses linked to non-core business activities, like interest paid on loan money.
Losses as Expenses
All expenses that go towards a loss-making sale of long-term assets, one-time or any other unusual costs, or expenses towards lawsuits.
Income Statement Structure
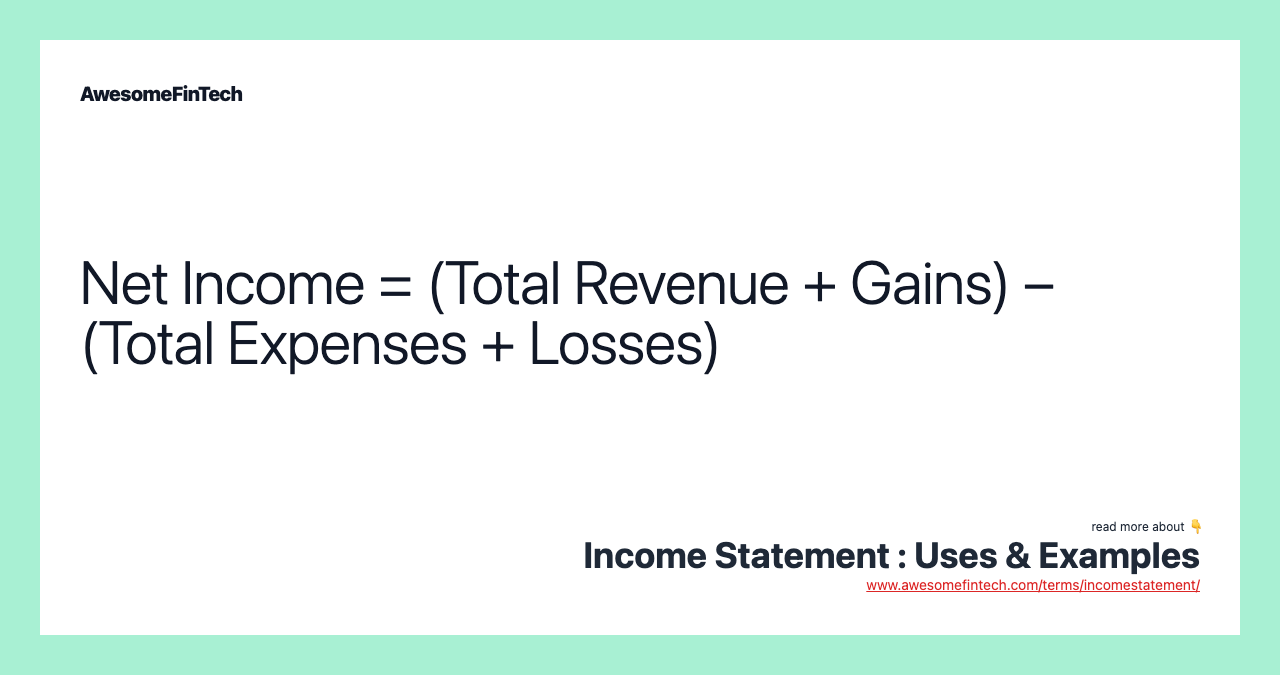
Mathematically, the Net Income is calculated based on the following:
Net Income = (Revenue + Gains) – (Expenses + Losses)
To understand the above details with some real numbers, let’s assume that a fictitious sports merchandise business, which additionally provides training, is reporting its income statement for the most recent quarter.

Image by Sabrina Jiang © Investopedia 2020
It received $25,800 from the sale of sports goods and $5,000 from training services. It spent various amounts as listed for the given activities that total $10,650. It realized net gains of $2,000 from the sale of an old van, and incurred losses worth $800 for settling a dispute raised by a consumer. The net income comes to $21,350 for the given quarter. The above example is the simplest forms of the income statement that any standard business can generate. It is called the Single-Step Income Statement as it is based on the simple calculation that sums up revenue and gains and subtracts expenses and losses.
However, real-world companies often operate on a global scale, have diversified business segments offering a mix of products and services, and frequently get involved in mergers, acquisitions, and strategic partnerships. Such wide array of operations, diversified set of expenses, various business activities, and the need for reporting in a standard format as per regulatory compliance leads to multiple and complex accounting entries in the income statement.
Listed companies follow the Multiple-Step Income Statement which segregates the operating revenues, operating expenses, and gains from the non-operating revenues, non-operating expenses, and losses, and offer many more details through the income statement. Essentially, the different measures of profitability in a multiple-step income statement are reported at four different levels in a business' operations – gross, operating, pre-tax and after-tax. As we shall shortly see in the following example, this segregation helps in identifying how the income and profitability are moving/changing from one level to the other. For instance, high gross profit but lower operating income indicates higher expenses, while higher pre-tax profit and lower post-tax profit indicates loss of earnings to taxes and other one-time, unusual expenses.
Let’s look at the most recent annual income statements of two large, publicly-listed, multinational companies from different sectors of Technology (Microsoft) and Retail (Walmart).
Income Statement Example

Image by Sabrina Jiang © Investopedia 2020
Reading Standard Income Statements
The focus in this standard format is to calculate the profit/income at each subhead of revenue and operating expenses and then account for mandatory taxes, interest, and other non-recurring, one-time events to arrive at the net income that is applicable to common stock. Though calculations involve simple additions and subtractions, the order in which the various entries appear in the statement and their relations often gets repetitive and complicated. Let’s take a deep dive into these numbers for better understanding.
Revenue Section
The first section titled “Revenue” indicates that Microsoft’s Gross (annual) Profit for the fiscal year ending June 30, 2018, was $72.007 billion. It was arrived at by deducting the cost of revenue ($38.353 billion) from the total revenue ($110.360 billion) realized by the technology giant during its fiscal year. Around 35% of Microsoft’s total sales went toward costs for revenue generation, while a similar figure for Walmart was around 75% ($373.396/$500.343). It indicates that Walmart incurred much higher cost compared to Microsoft to generate equivalent sales.
Operating Expenses
The next section called “Operating Expenses” again takes into account the cost of revenue ($38.353 billion) and total revenue ($110.360 billion) to arrive at the reported figures. As Microsoft spent $14.726 billion on research and development (R&D) and $22.223 billion on Selling General and Administrative Expense (SG&A) the Total Operating Expenses is computed by summing all these figures ($38.353 + $14.726 + $22.223) = $75.302 billion.
Reducing the total operating expenses from total revenue leads to Operating Income (or Loss) as ($110.360 - $75.302) = $35.058 billion. This figure represents the Earnings Before Interest and Taxes (EBIT) for its core business activities and is again used later to derive the net income.
A comparison of the line items indicates that Walmart did not spend anything on R&D, and had higher SGA and total operating expenses compared to Microsoft.
Income from Continuing Operations
The next section titled “Income from Continuing Operations” adds net other income or expenses (like one time earnings), interest-linked expenses and applicable taxes to arrive at the Net Income From Continuing Operations ($16.571 billion) for Microsoft, which is 60% higher than that of Walmart ($10.523 billion).
After discounting for any non-recurring events, the value of net income applicable to common shares is arrived at. Microsoft had a 68% higher net income of $16.571 billion compared to Walmart’s $9.862 billion.
The earnings per share are computed by dividing the net income figure by the number of weighted average shares outstanding. With 7.7 billion outstanding shares of Microsoft, its EPS comes to $16.571 billion/7.7 billion = $2.15 per share. With Walmart having 2.995 billion outstanding shares, its EPS comes to $3.29 per share.
Though the retail giant beats the technology leader in terms of annual EPS, Microsoft had a lower cost for generating equivalent revenue, higher net income from continuing operations, and higher net income applicable to common shares compared to Walmart.
Uses of Income Statements
Though the main purpose of an income statement is to convey details of profitability and business activities of the company to the stakeholders, it also provides detailed insights into the company’s internals for comparison across different businesses and sectors. Such statements are also prepared more frequently at the department- and segment-levels to gain deeper insights by the company management for checking the progress of various operations throughout the year, though such interim reports may remain internal to the company.
Creditors may find limited use of income statements as they are more concerned about a company’s future cash flows, instead of its past profitability. Research analysts use the income statement to compare year-on-year and quarter-on-quarter performance. One can infer whether a company's efforts in reducing the cost of sales helped it improve profits over time, or whether the management managed to keep a tab on operating expenses without compromising on profitability.
The Bottom Line
An income statement provides valuable insights into various aspects of a business. It includes a company’s operations, the efficiency of its management, the possible leaky areas that may be eroding profits, and whether the company is performing in line with industry peers.
Related terms:
Absolute Value
Absolute value is a measure of a company's or asset's intrinsic value. read more
Acquisition
An acquisition is a corporate action in which one company purchases most or all of another company's shares to gain control of that company. read more
Amortization : Formula & Calculation
Amortization is an accounting technique used to periodically lower the book value of a loan or intangible asset over a set period of time. read more
Balance Sheet : Formula & Examples
A balance sheet is a financial statement that reports a company's assets, liabilities and shareholder equity at a specific point in time. read more
Bottom-Up Investing
Bottom-up investing is an investment approach that focuses on the analysis of individual stocks and de-emphasizes the significance of macroeconomic cycles. read more
Business Valuation , Methods, & Examples
Business valuation is the process of estimating the value of a business or company. read more
Cash Flow
Cash flow is the net amount of cash and cash equivalents being transferred into and out of a business. read more
Cash Flow Statement & Examples
A cash flow statement is a financial statement that provides aggregate data regarding all cash inflows and outflows a company receives. read more
Cost of Goods Sold – COGS
Cost of goods sold (COGS) is defined as the direct costs attributable to the production of the goods sold in a company. read more
Comprehensive Income
Comprehensive income is the change in a company's net assets from non-owner sources. read more