Swing High
The term swing high is used in technical analysis. If a swing high forms just barely above the prior swing high, the price may still be in an uptrend, but it is not moving as strongly as the asset that made a much higher swing high. This is called a higher swing high because the swing high occurs above the prior swing high price. Toward the middle of the chart, there is a lower swing high followed by a higher swing high that just barely gets above the prior swing high. Alternatively, the trader may opt to exit before the price reaches resistance and the prior swing highs, or wait and see if the price can break through resistance and create a new swing high.
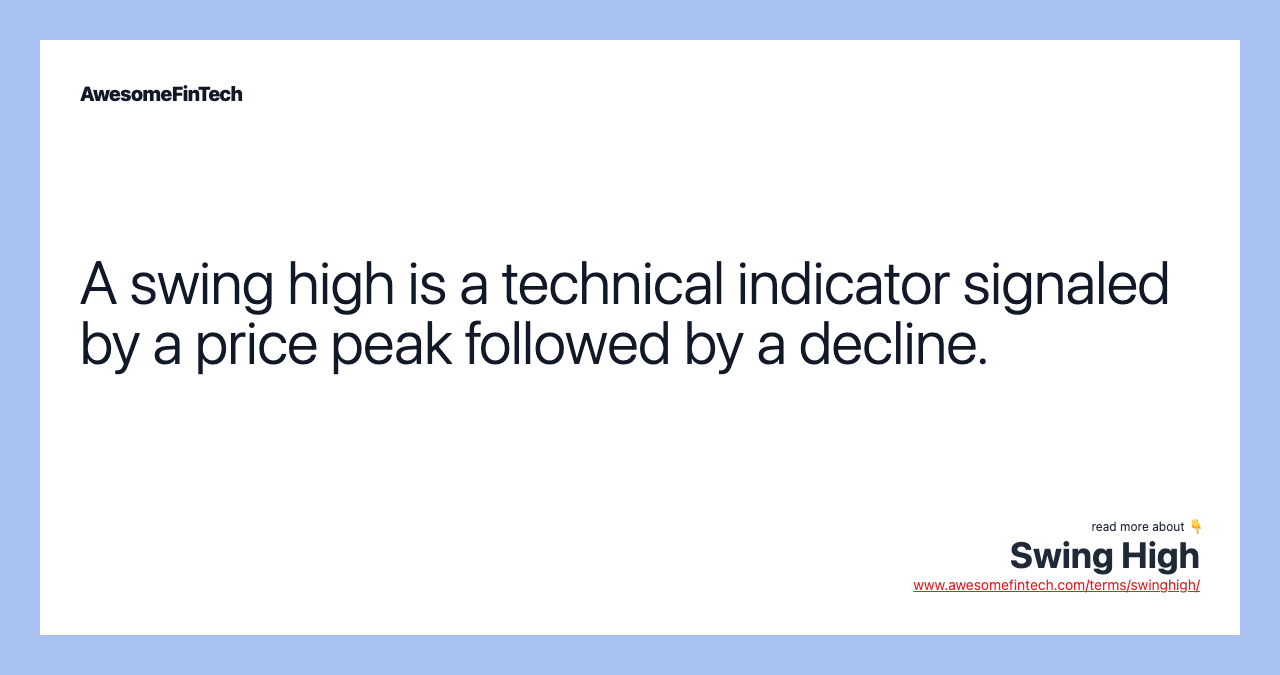
What Is a Swing High?
The term swing high is used in technical analysis. It refers to a peak reached by an indicator or a security’s price before a decline. A swing high forms when the high reached is greater than a given number of highs positioned around it. A series of consecutively higher swing highs indicates that the given security is in an uptrend. A swing high can occur in a rangebound or trending market.
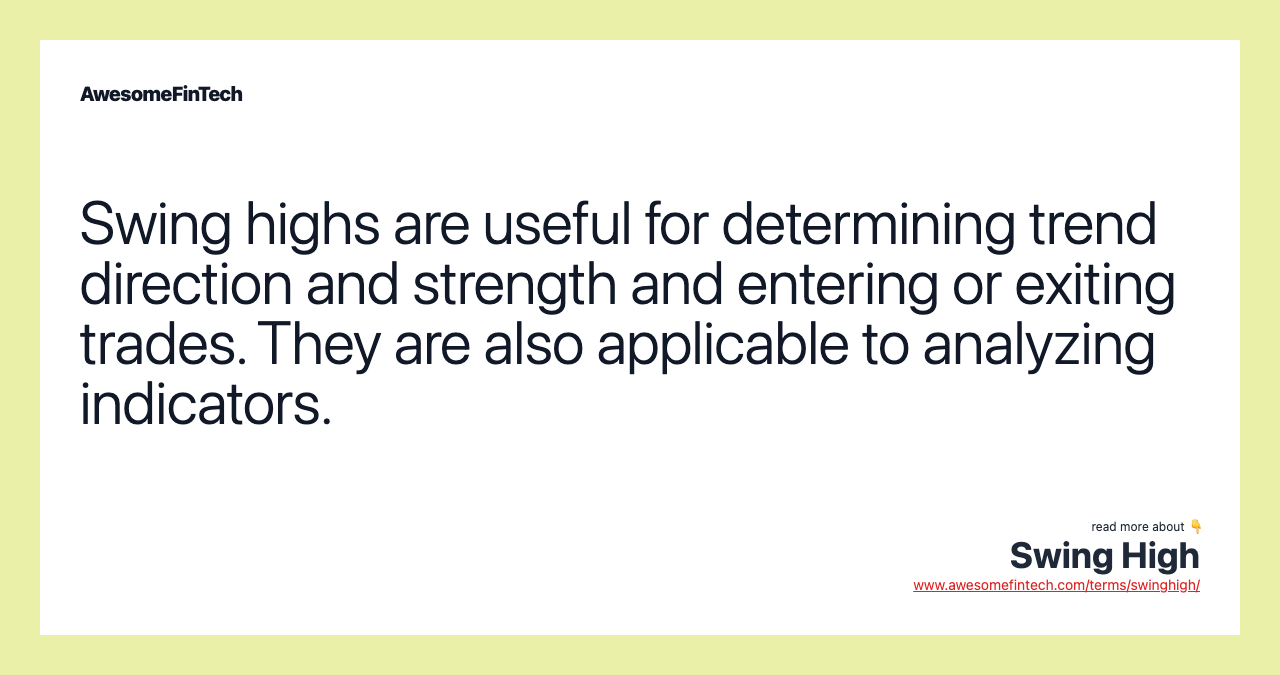
Swing highs are useful to identify and use when trend trading, trading in ranges, or when utilizing technical indicators. Analyzing swing highs helps the trader determine trend direction and trend strength.
The opposite of a swing high is a swing low.
How the Swing High Works
Once the price moves above a recent high, a new swing high is underway. The exact high point of that swing high is not known until the price starts dropping. Once the price starts dropping, the swing high is in place and the trader can note the swing high price.
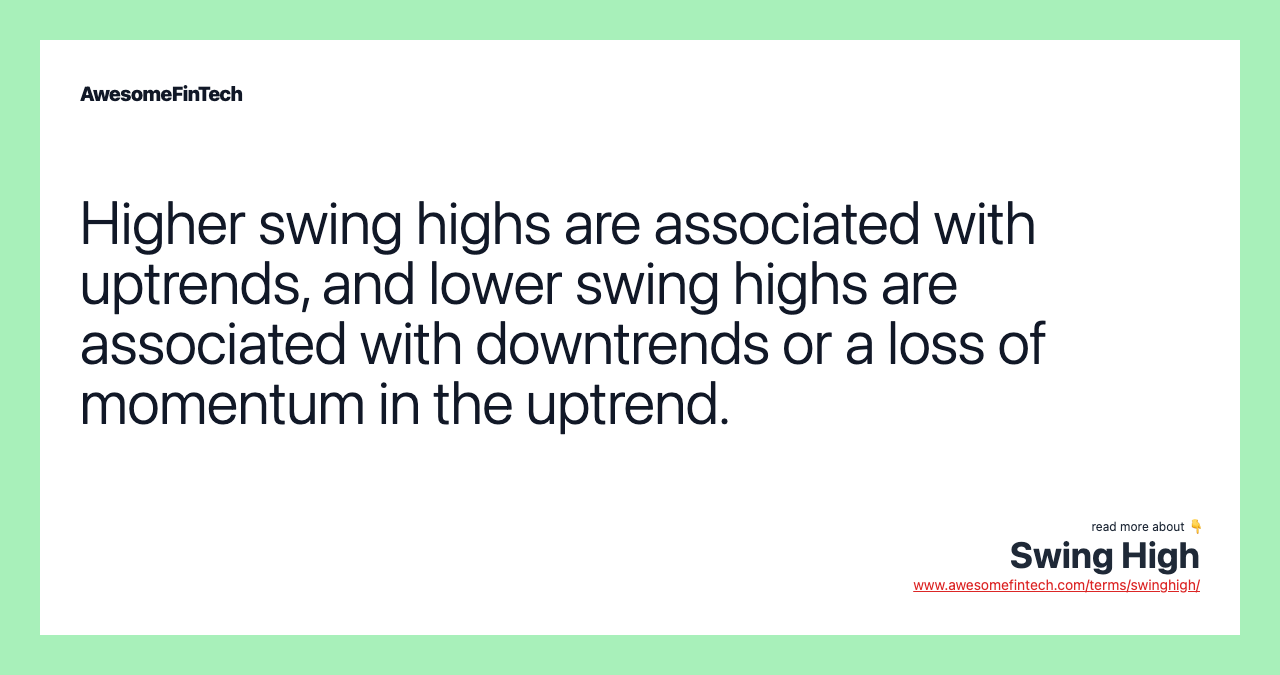
This is called a higher swing high because the swing high occurs above the prior swing high price. Higher swing highs are associated with uptrends since the price keeps moving to higher and higher prices.
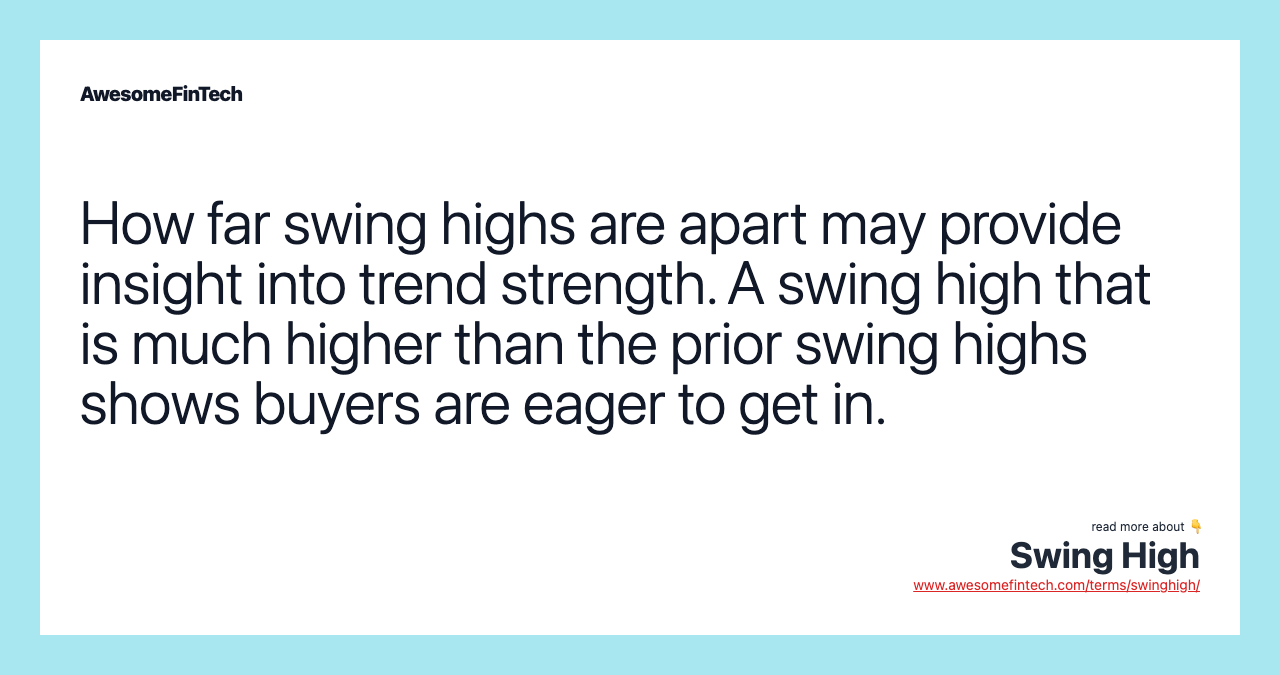
How far swing highs are apart is a sign of trend strength. If the most recent swing high was far above the prior swing high, that shows the asset has a lot of buying interest and strength. If a swing high forms just barely above the prior swing high, the price may still be in an uptrend, but it is not moving as strongly as the asset that made a much higher swing high.
There are also lower swing highs. A lower swing high occurs when the price rallies but then starts dropping before reaching the prior swing high. Lower swing highs are associated with downtrends, or uptrends that have lost momentum, since the price is no longer able to move into higher territory. If there are consecutive lower swing highs, a downtrend may be underway (if the price is also making lower swing lows).
Trading Swing Highs
Swing highs can be used for multiple analytical purposes in trading. Here are a few ideas on how to use them.
When Trend Trading: Swing highs in an overall downtrend form at the end of retracements. Traders could take a short position once a swing high is in place and momentum reverses back to the downside. Indicators and Japanese candlestick patterns could be used in conjunction with the swing high to increase the chance of a successful trade.
For example, a trader could require that the relative strength index (RSI) is above 70 when the price makes a swing high, and that a three black crows candlestick pattern (or another bearish pattern) subsequently appears to confirm a return to the overall downtrend. A stop-loss order could be placed above the swing high to minimize losses if the trade does not move in its intended direction.
If going long in an uptrend, some traders utilize new highs to exit positions once the price starts to fall from the swing high.
The Fibonacci extension tool can also be applied to the chart to show probable resistance areas between the swing high and swing low. For example, if a trader went long near the swing low, they could set a profit target at the 61.8%, 100%, or 161.8% Fibonacci levels.
Trading in Rangebound Markets: When the price is ranging — moving sideways between support and resistance — traders could initiate a long position near the prior swing lows at support. Wait until the price gets close to support, forms a swing low, and then starts to move higher again.
The prior swing highs, or resistance, can be used as an exit area for the long trade. Alternatively, the trader may opt to exit before the price reaches resistance and the prior swing highs, or wait and see if the price can break through resistance and create a new swing high.
A trader could also initiate a short position near the prior swing highs once the price starts to decline off of them. They could then look to exit near the prior swing lows (support), slightly above them, or wait for a breakout through support.
Indicator Divergence: If the price of an asset is rising, and making higher swing highs, momentum oscillators such as the RSI and moving average convergence divergence (MACD) typically should be as well. If the price is making higher swing highs, but these indicators are making lower swing highs, this is called divergence. The indicator is not confirming the price movement, which warns of a potential reversal in the price.
Divergence is not always a reliable signal. It sometimes occurs too early; the price keeps moving in its current direction and the divergence lasts a long time. Other times, it doesn't warn of a price reversal. Despite these drawbacks, some traders still opt to watch for divergence in relation to swing highs and lows.
Examples of Different Types of Swing Highs
The following chart of Apple Inc. shows how swing highs can be used to analyze price. The swing highs have been connected to each other by manually drawn lines. The lines help highlight the uptrend and downtrend, and the transitions in between.

Image by Sabrina Jiang © Investopedia 2021
On the left, the price is rising. There are higher swing highs, which the lines help highlight. Toward the middle of the chart, there is a lower swing high followed by a higher swing high that just barely gets above the prior swing high. This is not a strong move.
The price then retreats and forms yet another lower swing high. The price continues to drop, forming lower swing highs as it does.
The price then transitions again. The swing highs start moving back up, and the drawn lines show that the downtrend has leveled off. The price then starts making higher swing highs again, ushering in the next uptrend.
Related terms:
Divergence and Uses
Divergence is when the price of an asset and a technical indicator move in opposite directions. Divergence is a warning sign that the price trend is weakening, and in some case may result in price reversals. read more
Downtrend
A downtrend refers to the price action of a security that moves lower in price as it fluctuates over time. read more
Fibonacci Channel
The Fibonacci channel is a variation of the Fibonacci retracement tool, with support and resistance lines run diagonally rather than horizontally. read more
Fibonacci Extensions
Fibonacci extensions are a method of technical analysis commonly used to aid in placing profit targets. read more
Harami Cross and Example
A harami cross is a candlestick pattern that consists of a large candlestick followed by a doji. Sometimes it signals the start of a trend reversal. read more
Long Position
A long position conveys bullish intent as an investor will purchase the security with the hope that it will increase in value. read more
Moving Average Convergence Divergence (MACD)
Moving Average Convergence Divergence (MACD) is defined as a trend-following momentum indicator that shows the relationship between two moving averages of a security's price. read more
Range-Bound Trading
Range-bound trading is a trading strategy that seeks to identify and capitalize on securities trading in price channels. read more
Resistance (Resistance Level) & Example
Resistance refers to a level that the price action of an asset has difficulty rising above over a specific period of time. read more
Retracement
A retracement is a technical term used to identify a minor pullback or a temporary change in the direction of a financial instrument. read more