Negative Correlation
Table of Contents What Is Negative Correlation? Understanding Negative Correlation The Importance of Negative Correlation For example, if variables X and Y have a correlation coefficient of -0.1, they have a weak negative correlation, but if they have a correlation coefficient of -0.9, they would be regarded as having a strong negative correlation. By the same token, two variables with a perfect positive correlation would have a correlation coefficient of +1, while a correlation coefficient of zero implies that the two variables are uncorrelated and move independently of each other. In statistics, a perfect negative correlation is represented by the value -1.0, while a 0 indicates no correlation, and +1.0 indicates a perfect positive correlation. As the energy sector, for obvious reasons, has a positive correlation with crude oil prices, investing part of one's portfolio in airline stocks would provide a hedge against a decline in oil prices.
What Is Negative Correlation?
Negative correlation is a relationship between two variables in which one variable increases as the other decreases, and vice versa.
In statistics, a perfect negative correlation is represented by the value -1.0, while a 0 indicates no correlation, and +1.0 indicates a perfect positive correlation. A perfect negative correlation means the relationship that exists between two variables is exactly opposite all of the time.
Understanding Negative Correlation
Negative correlation or inverse correlation indicates that two individual variables have a statistical relationship such that their prices generally move in opposite directions from one another. If, for instance, variables X and Y have a negative correlation (or are negatively correlated), as X increases in value, Y will decrease; similarly, if X decreases in value, Y will increase.
The degree to which one variable moves in relation to the other is measured by the correlation coefficient, which quantifies the strength of the correlation between two variables. For example, if variables X and Y have a correlation coefficient of -0.1, they have a weak negative correlation, but if they have a correlation coefficient of -0.9, they would be regarded as having a strong negative correlation.
The higher the negative correlation between two variables, the closer the correlation coefficient will be to the value -1. By the same token, two variables with a perfect positive correlation would have a correlation coefficient of +1, while a correlation coefficient of zero implies that the two variables are uncorrelated and move independently of each other.
The correlation coefficient, usually denoted by "r" or "R", can be determined by regression analysis. The square of the correlation coefficient (generally denoted by "R2", or R-squared) represents the degree or extent to which the variance of one variable is related to the variance of the second variable, and is typically expressed in percentage terms.
For example, if a portfolio and its benchmark have a correlation of 0.9, the R-squared value would be 0.81. The interpretation of this figure is that 81% of the variation in the portfolio (the dependent variable in this case) is related to — or can be explained by — the variation of the benchmark (the independent variable).
The degree of correlation between two variables is not static, but can swing over a wide range — or from positive to negative, and vice versa — over time.

Graphs showing positive, negative, and no correlation. Illustration by Hugo Lin. © 2018 ThoughtCo.
The Importance of Negative Correlation
The concept of negative correlation is a key one in portfolio construction. Negative correlation between sectors or geographies enables the creation of diversified portfolios that can better withstand market volatility and smooth out portfolio returns over the long term.
The building of large and complex portfolios where the correlations are carefully balanced to provide more predictable volatility is generally referred to as the discipline of strategic asset allocation.
Consider the long-term negative correlation between stocks and bonds. Stocks generally outperform bonds during periods of strong economic performance, but as the economy slows down and the central bank reduces interest rates to stimulate the economy, bonds may outperform stocks.
As an example, assume you have a $100,000 balanced portfolio that is invested 60% in stocks and 40% in bonds. In a year of strong economic performance, the stock component of your portfolio might generate a return of 12%, while the bond component may return -2% because interest rates are on a rising trend. Thus, the overall return on your portfolio would be 6.4% ((12% x 0.6) + (-2% x 0.4).
The following year, as the economy slows markedly and interest rates are lowered, your stock portfolio might generate -5% while your bond portfolio may return 8%, giving you an overall portfolio return of 0.2%.
What if, instead of a balanced portfolio, your portfolio was 100% equities? Using the same return assumptions, your all-equity portfolio would have a return of 12% in the first year and -5% in the second year, which are more volatile than the balanced portfolio's returns of 6.4% and 0.2%.
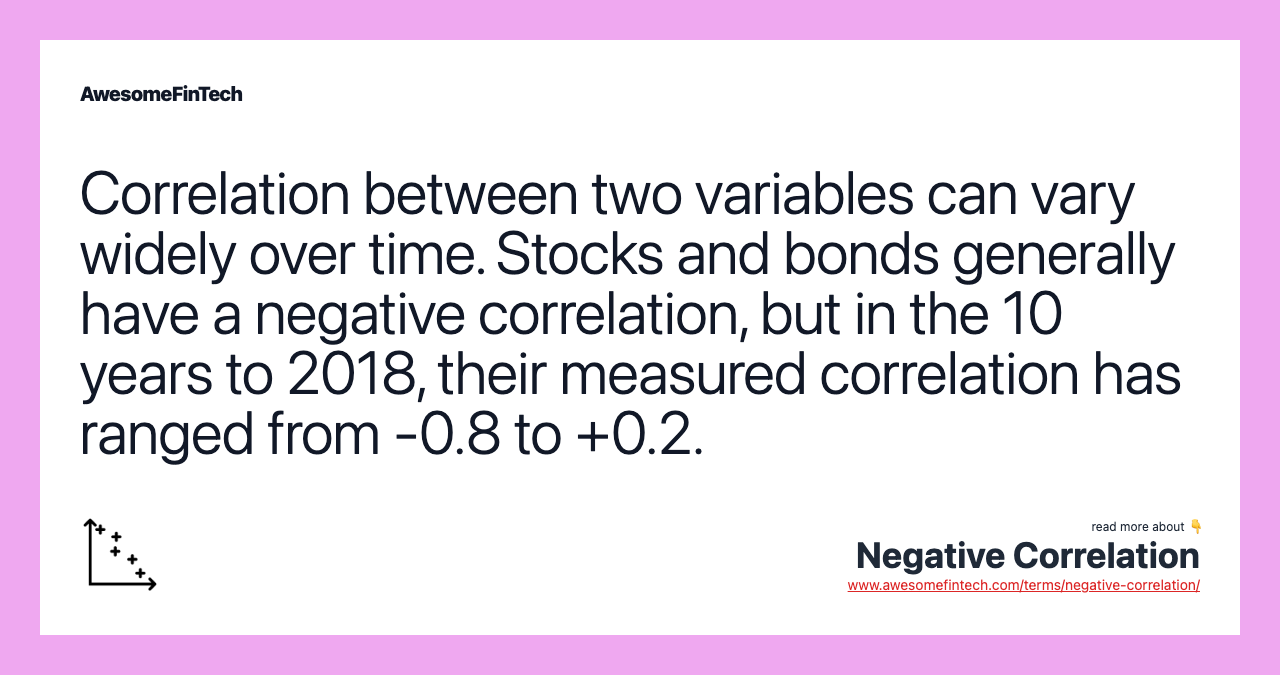
Equities and bonds generally have a negative correlation, but in the 10 years to 2018, their correlation has ranged from approximately -0.8 to +0.2, according to BlackRock.
Examples of Negative Correlation
Examples of negative correlation are common in the investment world. A well-known example is the negative correlation between crude oil prices and airline stock prices. Jet fuel, which is derived from crude oil, is a large cost input for airlines and has a significant impact on their profitability and earnings.
If the price of crude oil spikes up, it could have a negative impact on airlines' earnings and hence on the price of their stocks. But if the price of crude oil trends lower, this should boost airline profits and therefore their stock prices.
Here's how the existence of this phenomenon can help in the construction of a diversified portfolio. As the energy sector has a substantial weight in most equity indices, many investors have significant exposure to crude oil prices, which are typically quite volatile. As the energy sector, for obvious reasons, has a positive correlation with crude oil prices, investing part of one's portfolio in airline stocks would provide a hedge against a decline in oil prices.
Special Considerations
It should be noted that this investment thesis may not work all of the time, as the typical negative correlation between oil prices and airline stocks might occasionally turn positive. For example, during an economic boom, oil prices and airline stocks may both rise; conversely, during a recession, oil prices and airline stocks could slide in tandem.
When negative correlation between two variables breaks down, it can play havoc with investment portfolios. For example, US equity markets experienced their worst performance in a decade in the fourth quarter of 2018, partly fueled by concerns that the Federal Reserve (Fed) would continue to raise interest rates.
Fears of rising rates also took their toll on bonds, leading their normally negative correlation with stocks to fall to the weakest levels in decades. At such times, investors often discover to their chagrin that there is no place to hide.
Related terms:
Balanced Investment Strategy
A balanced investment strategy combines asset classes in a portfolio in an attempt to balance risk and return. read more
Benchmark
A benchmark is a standard against which the performance of a security, mutual fund or investment manager can be measured. read more
Bond : Understanding What a Bond Is
A bond is a fixed income investment in which an investor loans money to an entity (corporate or governmental) that borrows the funds for a defined period of time at a fixed interest rate. read more
Central Bank
A central bank conducts a nation's monetary policy and oversees its money supply. read more
Correlation
Correlation is a statistical measure of how two securities move in relation to each other. read more
Correlation Coefficient
The correlation coefficient is a statistical measure that calculates the strength of the relationship between the relative movements of two variables. read more
Crude Oil & Investing Examples
Crude oil is a naturally occurring, unrefined petroleum product composed of hydrocarbon deposits and other organic materials. read more
Diversification
Diversification is an investment strategy based on the premise that a portfolio with different asset types will perform better than one with few. read more
Earnings
A company's earnings are its after-tax net income, meaning its profits. Earnings are the main determinant of a public company's share price. read more
Equity : Formula, Calculation, & Examples
Equity typically refers to shareholders' equity, which represents the residual value to shareholders after debts and liabilities have been settled. read more