Heikin-Ashi Technique
The Heikin-Ashi technique averages price data to create a Japanese candlestick chart that filters out market noise. \\text{Heikin-Ashi Low} = \\text{Min } ( \\text{Low}\_0, \\text{HA Open}\_0, \\text{HA Close}\_0 ) \\\\ &\\textbf{where:} \\\\ &\\text{Open}\_0 \\text{ etc.} = \\text{Values from the current period} \\\\ &\\text{Open}\_{-1} \\text{ etc.} = \\text{Values from the prior period} \\\\ &\\text{HA} = \\text{Heikin-Ashi} \\\\ \\end{aligned} Heikin-Ashi Close\=4Open0+High0+Low0+Close0Heikin-Ashi Open\=2HA Open−1+HA Close−1Heikin-Ashi High\=Max (High0,HA Open0,HA Close0)Heikin-Ashi Low\=Min (Low0,HA Open0,HA Close0)where:Open0 etc.\=Values from Heikin-Ashi Open \= HA Open − 1 \+ HA Close − 1 2 Heikin-Ashi High \= Max ( High 0 , HA Open 0 , HA Close 0 ) Instead of using the open, high, low, and close like standard candlestick charts, the Heikin-Ashi technique uses a modified formula based on two-period averages. Because the Heikin-Ashi technique smooths price information over two periods, it makes trends, price patterns, and reversal points easier to spot.
What Is the Heikin-Ashi Technique?
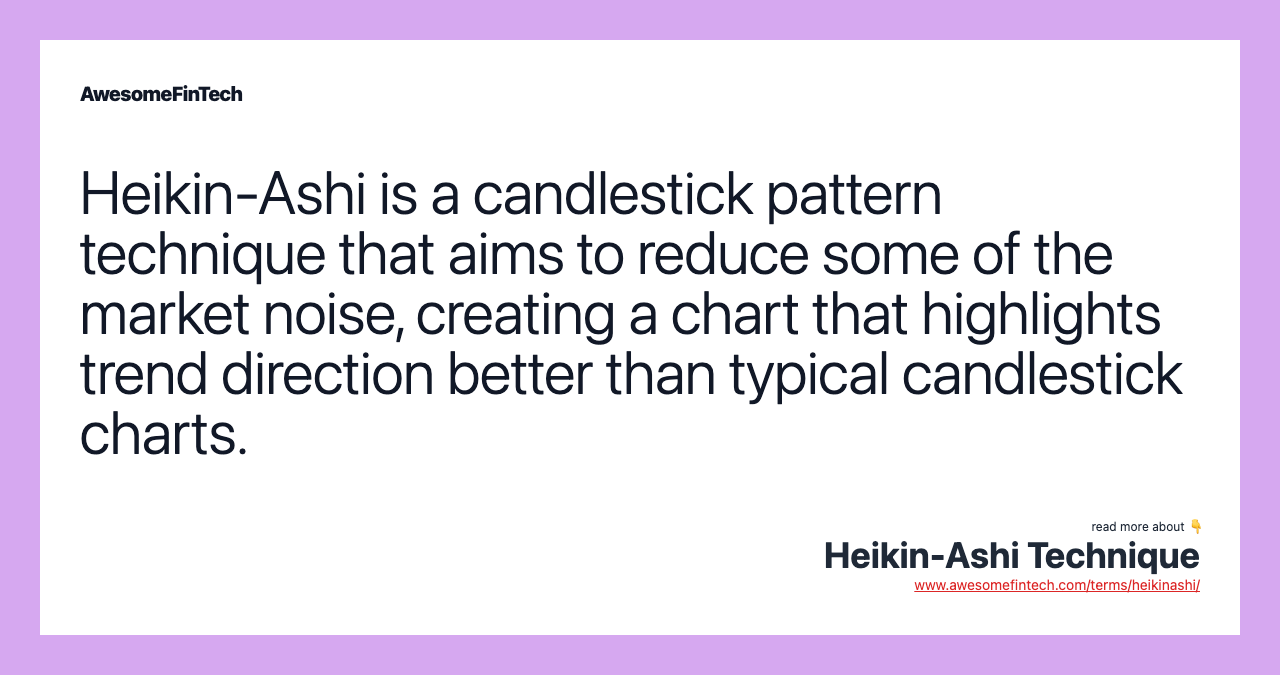
The Heikin-Ashi technique averages price data to create a Japanese candlestick chart that filters out market noise.
Heikin-Ashi charts, developed by Munehisa Homma in the 1700s, share some characteristics with standard candlestick charts but differ based on the values used to create each candle. Instead of using the open, high, low, and close like standard candlestick charts, the Heikin-Ashi technique uses a modified formula based on two-period averages. This gives the chart a smoother appearance, making it easier to spots trends and reversals, but also obscures gaps and some price data.
The Formula for the Heikin-Ashi Technique Is:
Heikin-Ashi Close = Open 0 + High 0 + Low 0 + Close 0 4 Heikin-Ashi Open = HA Open − 1 + HA Close − 1 2 Heikin-Ashi High = Max ( High 0 , HA Open 0 , HA Close 0 ) Heikin-Ashi Low = Min ( Low 0 , HA Open 0 , HA Close 0 ) where: Open 0 etc. = Values from the current period Open − 1 etc. = Values from the prior period HA = Heikin-Ashi \begin{aligned} &\text{Heikin-Ashi Close} = \frac{ \text{Open}_0 + \text{High}_0 + \text{Low}_0 + \text{Close}_0 }{ 4 } \\ &\text{Heikin-Ashi Open} = \frac{ \text{HA Open}_{-1} + \text{HA Close}_{-1} }{ 2 } \\ &\text{Heikin-Ashi High} = \text{Max } ( \text{High}_0, \text{HA Open}_0, \text{HA Close}_0 ) \\ &\text{Heikin-Ashi Low} = \text{Min } ( \text{Low}_0, \text{HA Open}_0, \text{HA Close}_0 ) \\ &\textbf{where:} \\ &\text{Open}_0 \text{ etc.} = \text{Values from the current period} \\ &\text{Open}_{-1} \text{ etc.} = \text{Values from the prior period} \\ &\text{HA} = \text{Heikin-Ashi} \\ \end{aligned} Heikin-Ashi Close=4Open0+High0+Low0+Close0Heikin-Ashi Open=2HA Open−1+HA Close−1Heikin-Ashi High=Max (High0,HA Open0,HA Close0)Heikin-Ashi Low=Min (Low0,HA Open0,HA Close0)where:Open0 etc.=Values from the current periodOpen−1 etc.=Values from the prior periodHA=Heikin-Ashi
How to Calculate Heikin-Ashi
- Use one period to create the first Heikin-Ashi (HA) candle, using the formulas. For example, use the high, low, open, and close to create the first HA close price. Use the open and close to create the first HA open. The high of the period will be the first HA high, and the low will be the first HA low.
- With the first HA calculated, it is now possible to continue computing the HA candles per the formulas.
- To calculate the next close, use the open, high, low, and close from that period.
- To calculate the next open, use the prior open and prior close.
- To calculate the next high, choose the max of the current period's high, or the current period's HA open or close.
- To calculate the next low, choose the max of the current period's low, or the current period's HA open or close.
- For steps five and six remember that the HA open and close are not the same as the period's open and close. The HA open and close were calculated in steps three and four.

Image by Sabrina Jiang © Investopedia 2021
What Does Heikin-Ashi Tell You?
The Heikin-Ashi technique is used by technical traders to identify a given trend more easily. Hollow white (or green) candles with no lower shadows are used to signal a strong uptrend, while filled black (or red) candles with no upper shadow are used to identify a strong downtrend.
Reversal candlesticks using the Heikin-Ashi technique are similar to traditional candlestick reversal patterns; they have small bodies and long upper and lower shadows. There are no gaps on a Heikin-Ashi chart as the current candle is calculated using information from the previous candle.
Because the Heikin-Ashi technique smooths price information over two periods, it makes trends, price patterns, and reversal points easier to spot. Candles on a traditional candlestick chart frequently change from up to down, which can make them difficult to interpret. Heikin-Ashi charts typically have more consecutive colored candles, helping traders to identify past price movements easily.
The Heikin-Ashi technique reduces false trading signals in sideways and choppy markets to help traders avoid placing trades during these times. For example, instead of getting two false reversal candles before a trend commences, a trader who uses the Heikin-Ashi technique is likely only to receive the valid signal.
Heikin-Ashi vs. Renko Charts
Heikin-Ashi charts are constructed based on averages over two periods. Renko charts, on the other hand, are created by only showing movements of a certain size.
While a Renko chart has a time axis, the boxes or bricks are not governed by time, only by movement. While a new HA candle will form every period, a Renko chart will only produce a new brick/box when the price has moved a certain amount.

Heikin-Ashi.
Image by Sabrina Jiang © Investopedia 2020
Limitations of the Heikin-Ashi Technique
Since the Heikin-Ashi technique uses price information from two periods, a trade setup takes longer to develop. Usually, this is not an issue for swing traders who have time to let their trades play out. However, day traders who need to exploit quick price moves may find Heikin-Ashi charts are not responsive enough to be useful.
The averaged data also obscures important price information. Daily closing prices are considered important by many traders, yet the actual daily closing price is not seen on a Heikin-Ashi chart. The trader only sees the averaged HA closing value. In order to control risk, it is important the trader is aware of the actual price, and not just the HA averaged values.
Another important element in technical analysis that is missing from Heikin-Ashi charts is price gaps. Many traders use gaps for analyzing price momentum, setting stop-loss levels, or triggering entries.
Example Using Heikin-Ashi Candlesticks
Hieken-Ashi charts can be applied to any market and most charting platforms now have them included as a functionality. There are five primary signals that identify trends and buying opportunities:
- Hollow or green candles with no lower "shadows" indicate a strong uptrend: Let your profits ride!
- Hollow or green candles signify an uptrend: You might want to add to your long position and exit short positions.
- Candles with a small body surrounded by upper and lower shadows indicate a trend change: Risk-loving traders might buy or sell here, while others will wait for confirmation before going long or short.
- Filled or red candles indicate a downtrend: You might want to add to your short position and exit long positions.
- Filled or red candles with no higher shadows identify a strong downtrend: Stay short until there's a change in trend.
These signals may make locating trends or trading opportunities easier than with traditional candlesticks. The trends are not interrupted by false signals as often and are thus more easily spotted.

Heikin-Ashi.
Image by Sabrina Jiang © Investopedia 2020
The chart example above shows how Heikin-Ashi charts can be used for analysis and making trading decisions. On the left, there are long red candles, and at the start of the decline, the lower wicks are quite small. As the price continues to drop, the lower wicks get longer, indicating that the price dropped but then was pushed back up. Buying pressure is starting to build. This is followed by a strong move to the upside.
The upward move is strong and doesn't give major indications of a reversal, until there are several small candles in a row, with shadows on either side. This shows indecision. Traders can look at the bigger picture to help determine whether they should go long or short.
The charts can also be used to keep a trader in a trade once a trend begins. It's usually best to stay in a trade until the Heikin-Ashi candles change color. However, a change of color doesn't always mean the end of a trend — it could just be a pause.
Related terms:
Bearish Abandoned Baby
A bearish abandoned baby is a type of candlestick pattern identified by traders to signal a reversal in the current uptrend. read more
Candlestick
A candlestick is a type of price chart that displays the high, low, open, and closing prices of a security for a specific period and originated from Japan. read more
Choppy Market
A choppy market refers to a market condition where prices swing up and down considerably, either in the short term, or for an extended period of time. read more
Closing Price
Even in the era of 24-hour trading, there is a closing price for a stock or other asset, and it is the last price it trades at during market hours. read more
Downtrend
A downtrend refers to the price action of a security that moves lower in price as it fluctuates over time. read more
False Signal
In technical analysis, a false signal refers to an indication of future price movements that gives an inaccurate picture of the economic reality. read more
Gap
A gap is an area on a technical chart where an asset's price jumps higher or lower from the previous day’s close. read more
Ladder Bottom/Top
Ladder bottom/top are reversal patterns composed of five candlesticks that may also act as continuation patterns. read more
Long Position
A long position conveys bullish intent as an investor will purchase the security with the hope that it will increase in value. read more